Analysis
Overview
Hyperchroma analyzes large amounts of audio data in order to synchronize visualizations with audio. The analysis view shows information and configurations related to audio analysis that Hyperchroma performs.
Energy Detection
The energy curve shows the energy or perceived loudness over time for the audio currently being played.
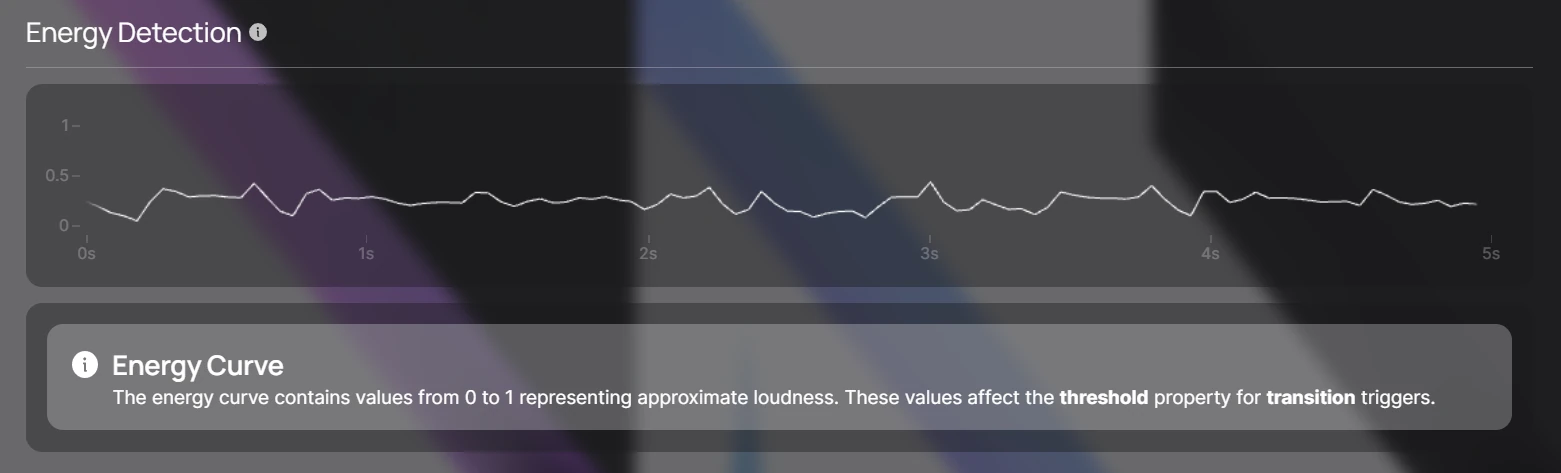
The values in this curve are used as a threshold value to determine if transitions should be triggered.
Novelty Detection
The novelty curve shows distinct beats and notes over time for the audio currently being played.
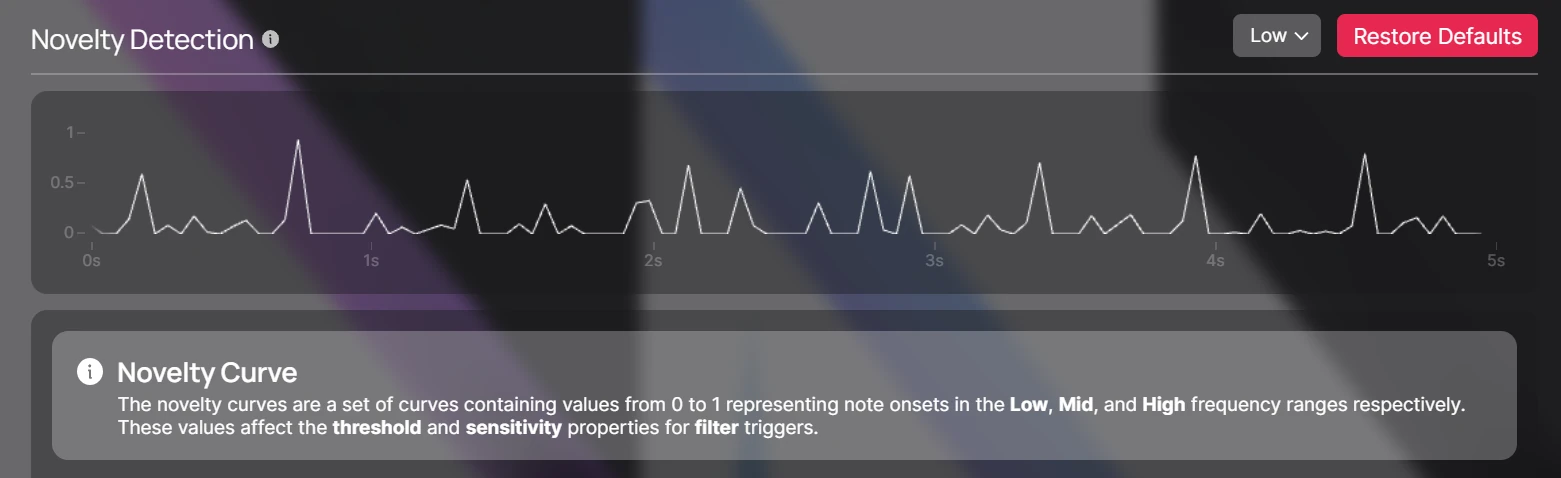
The values in this curve are used as a threshold value to determine if filters should be triggered. These values are also affected by the sensitivity property configured in filter effects.
There are three different configurable novelty curves available, each with their own different set of configurations:
- Low: intended for low frequency beats and notes such as bass, kick, snares, etc.
- Mid: intended for mid frequency beats and notes such as vocals, certain instruments, etc.
- High: intended for high frequency beats and notes such as high-pitched instruments, synthetic notes, etc.
Frequency Range
The frequency range determines the range of audio frequencies that Hyperchroma analyzes for novelty detection. In general lower pitched sounds will occupy lower frequencies and higher pitched sounds will occupy higher frequencies.
Audio Spectrum
Hyperchroma classifies the frequencies it analyzes into multiple spectrums:
- Raw: the raw frequency spectrum
- Harmonic: the harmonic frequency spectrum, which primarily contains harmonic notes and beats
- Percussive: the percussive frequency spectrum, which primarily contains percussive notes and beats
You can choose the spectrum which best fits the audio profile you want to visualize.
Normalization
Normalizes the values in the novelty curve. Increase this value if you see too many peaks exceeding the maximum novelty value.
Spectral Smoothing
Affects the accuracy of the audio spectrum classification. Increasing this value increases the accuracy of classified frequencies, but will also reduce the resolution of time each novelty value represents.
Note that increasing this value can impact performance.
Spectral Separation
Affects the accuracy of the audio spectrum classification. Increasing this value increases the confidence of classified frequencies, but will also reduce the amount of frequencies accepted.
Transition Detection
The transition curve shows perceived musical transitions over time for the audio currently being played. These values are used to trigger configured transition effects.
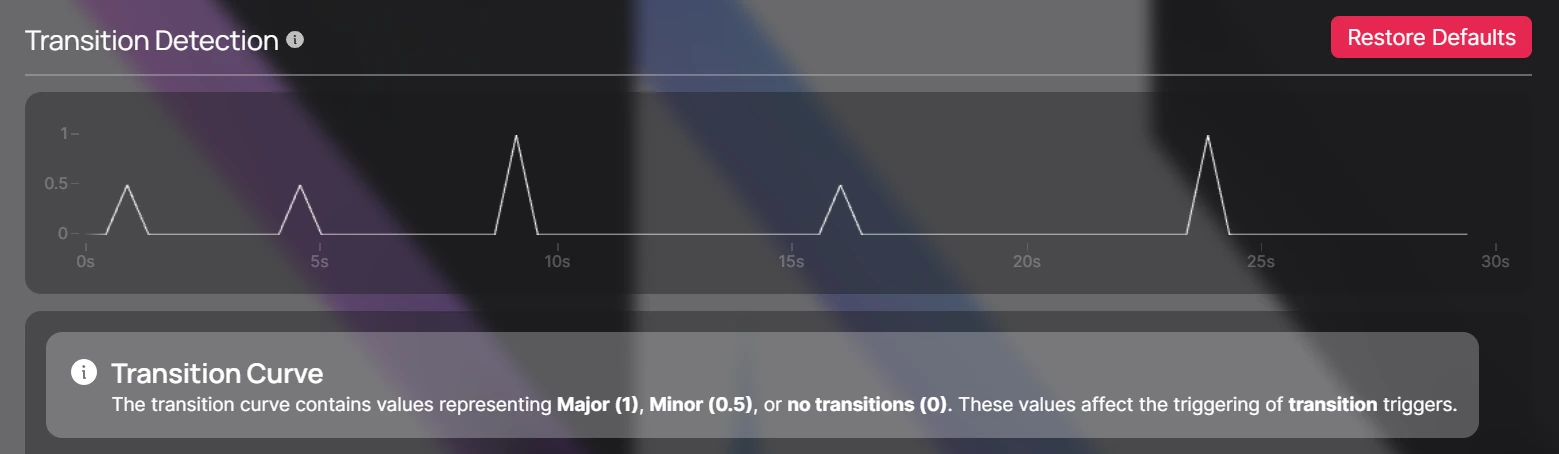
Transition Types
Hyperchroma classifies transitions it analyzes into multiple types:
- Major: indicates major musical transitions over a long period of time
- Minor: indicates minor musical transitions over a short period of time
Chroma Downsampling
Affects the resolution of the units of time used for detecting transitions. Increasing this value will increase the overall accuracy of transitions but also decrease the frequency of transitions.
Note that decreasing this value can impact performance.
Chroma Smoothing
Affects the accuracy of detected transitions. Increasing this value increases the accuracy of detected transitions, but will also reduce the resolution of time each transition represents.
Note that increasing this value can impact performance.
Major Transition Window
Affects the window of time that major transitions represent. Increasing this value will result in major transitions that represent transitions over longer periods of time.
It is recommended to adjust this value accordingly whenever the Chroma Downsampling is changed.
Minor Transition Window
Affects the window of time that minor transitions represent. Increasing this value will result in minor transitions that represent transitions over longer periods of time.
It is recommended to adjust this value accordingly whenever the Chroma Downsampling is changed.